Frequency And Frequency Distribution MCQ Tests
8th Class Math MCQ Tests
Frequency And Frequency Distribution
of 8th Class Math has 10 questions. If you take an online MCQ test, the system will randomly choose the questions. If you want to take the quiz by chapter then click the start test button.
Total Questions: 10
Total Marks: 10
Time: 10 Mins
Total Questions: 10
Total Marks: 10
Time: 10 Mins
10Min : 00 Sec Remaining
Question # 1
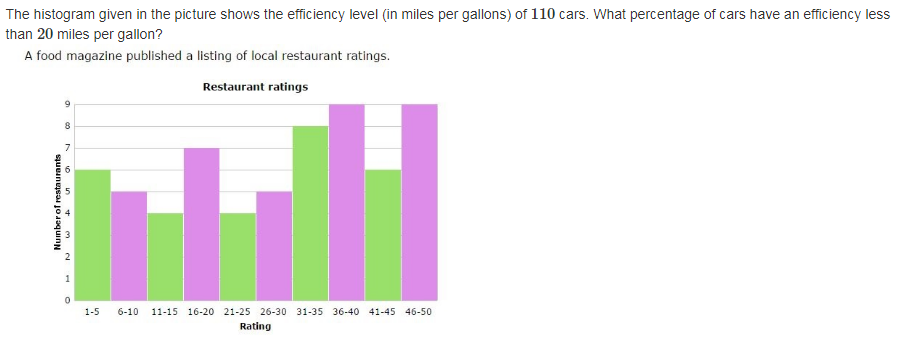
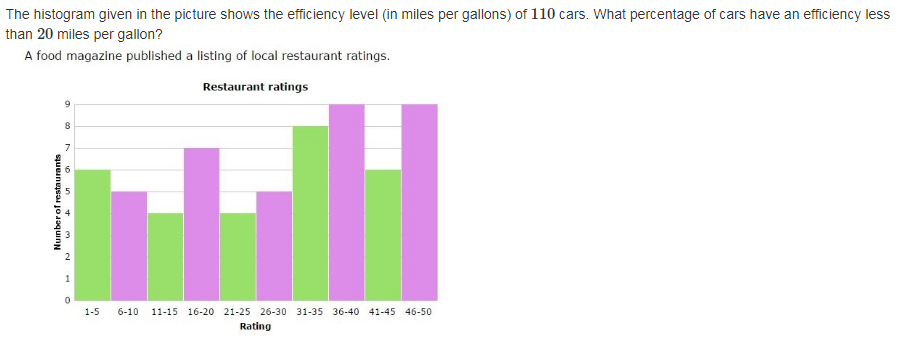
The histogram given in the picture shows the efficiency level (in miles per gallons) of 110 cars. What percentage of cars have an efficiency less than 20 miles per gallon?
Question # 2
Determine the mode of 2 , 4 , 6 , 4 , 1 , 1 , 2 , 8 , 4 , 5 , 6 , 7 , 6 .
Question # 3
Find the precentage increase in number of workers of two classes with highest weekly wages as compared to two classes with lowest weekly wages. See table below:

Question # 4
Find the mode of the values 5 , 7 , 2 , 9 , 7 , 10 , 8 , 5 , 7 .
Question # 5
The ages of 12 randomly selected customers at a local Best Buy are listed below: 23 , 21 , 29 , 24 , 31 , 21 , 27 , 23 , 24 , 32 , 33 , 19 . What is the mode of the above ages?
Question # 6
In a class interval ( 26 − 31 ) , 26 is _____.

Question # 7
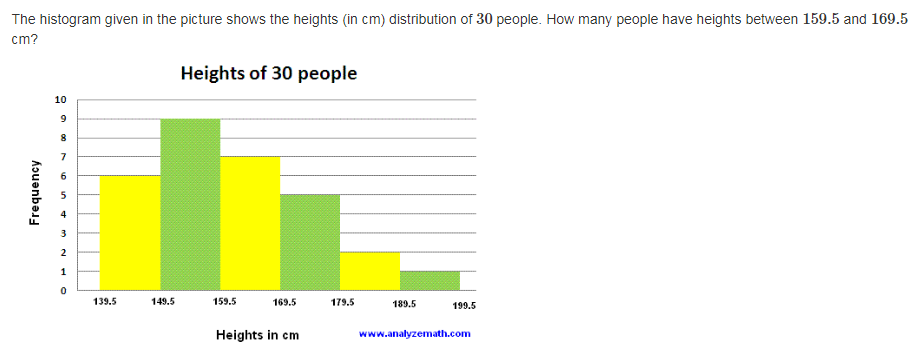
The histogram given in the picture shows the heights (in cm) distribution of 30 people. How many people have heights between 159.5 and 169.5 cm?
Question # 8
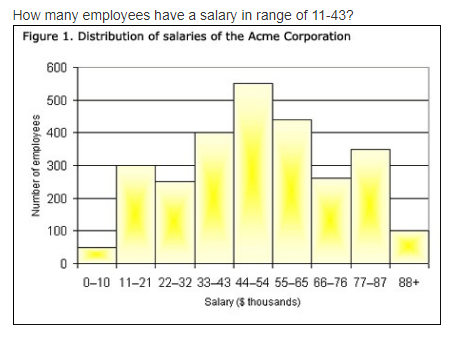
How many employees have a salary in range of 11-43?
Question # 9
What percentage increase in number of workers of class with highest weekly wages as compared to class with lowest weekly wages?

Question # 10
The size of shirts manufactured by a tailor are as follows 32 , 33 , 35 , 39 , 33 , 37 , 42 , 33 , 36 . Find the mode of the above data.
Total Questions
12345678910
Question # 1
The histogram given in the picture shows the efficiency level (in miles per gallons) of 110 cars. What percentage of cars have an efficiency less than 20 miles per gallon?
Question # 2
Determine the mode of 2 , 4 , 6 , 4 , 1 , 1 , 2 , 8 , 4 , 5 , 6 , 7 , 6 .
Question # 3
Find the precentage increase in number of workers of two classes with highest weekly wages as compared to two classes with lowest weekly wages. See table below:
Question # 4
Find the mode of the values 5 , 7 , 2 , 9 , 7 , 10 , 8 , 5 , 7 .
Question # 5
The ages of 12 randomly selected customers at a local Best Buy are listed below: 23 , 21 , 29 , 24 , 31 , 21 , 27 , 23 , 24 , 32 , 33 , 19 . What is the mode of the above ages?
Question # 6
In a class interval ( 26 − 31 ) , 26 is _____.
Question # 7
The histogram given in the picture shows the heights (in cm) distribution of 30 people. How many people have heights between 159.5 and 169.5 cm?
Question # 8
How many employees have a salary in range of 11-43?
Question # 9
What percentage increase in number of workers of class with highest weekly wages as compared to class with lowest weekly wages?
Question # 10
The size of shirts manufactured by a tailor are as follows 32 , 33 , 35 , 39 , 33 , 37 , 42 , 33 , 36 . Find the mode of the above data.
Total Questions
12345678910
Math
8th Class Punjab MCQ Tests






8th Class Online Classes 2026
Updated on: 27-10-2026
8th Class Online Preparation
8th Class 2026 Online
8th Class 2026
Add a Comment
Comments will be shown after admin approval.
Spam comments will not be approved at all.
Matric Result 2026 Punjab
10th Class Result 2026 Punjab
9th Class Result 2026 Punjab Boards
10th Class Result Gazette 2026 Punjab
Punjab Past Papers Matric 9th 10th
Primary Results 5th & 8th Class
BISE Results Intermediate & Matric
BISE Punjab Boards
Sindh Educational Boards
KPK Examination Boards
Technical Boards
Public Service Commission
University Results Gruaduation, Masters Classes
Subscribe by Email
Subscribe by Email
Subscribe to Rss Feed


Position Holders Matric 2026
Position Holders 9th Class 2026
Position Holders Inter 2026
Position Holders 11th Class 2026
Punjab 8th Class Math Frequency And Frequency Distribution